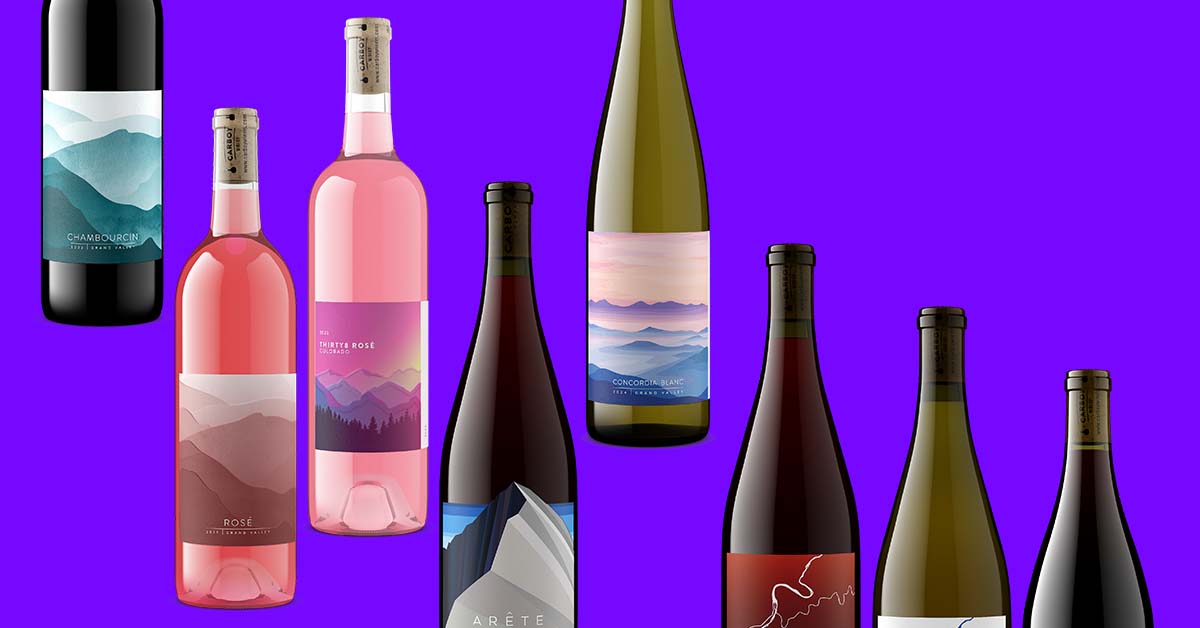
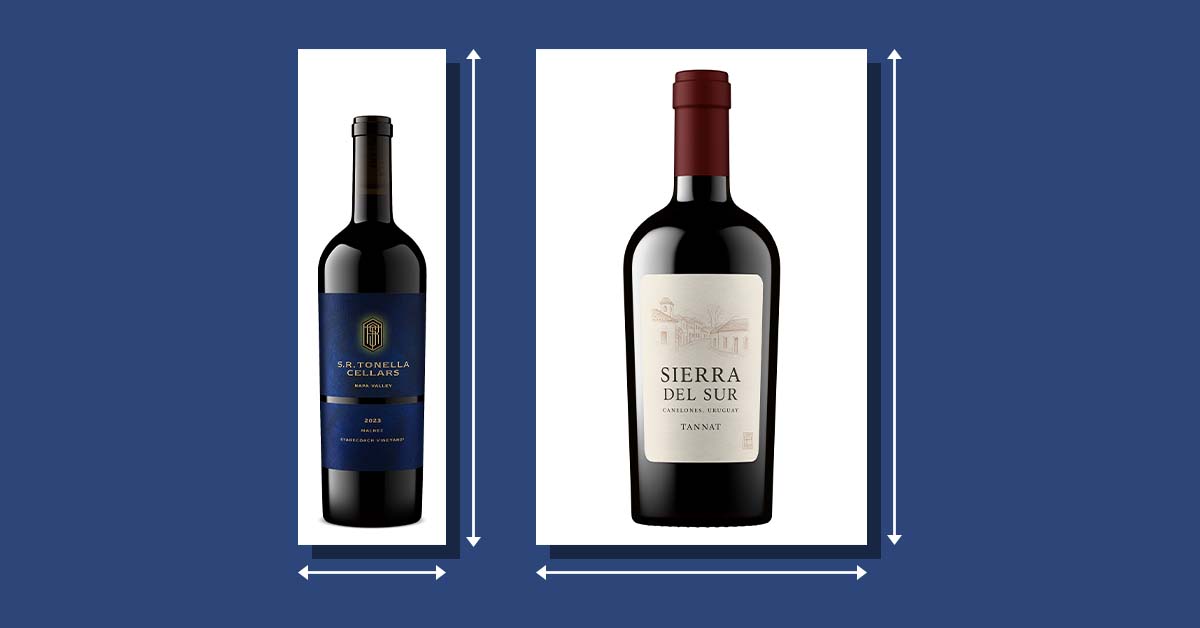
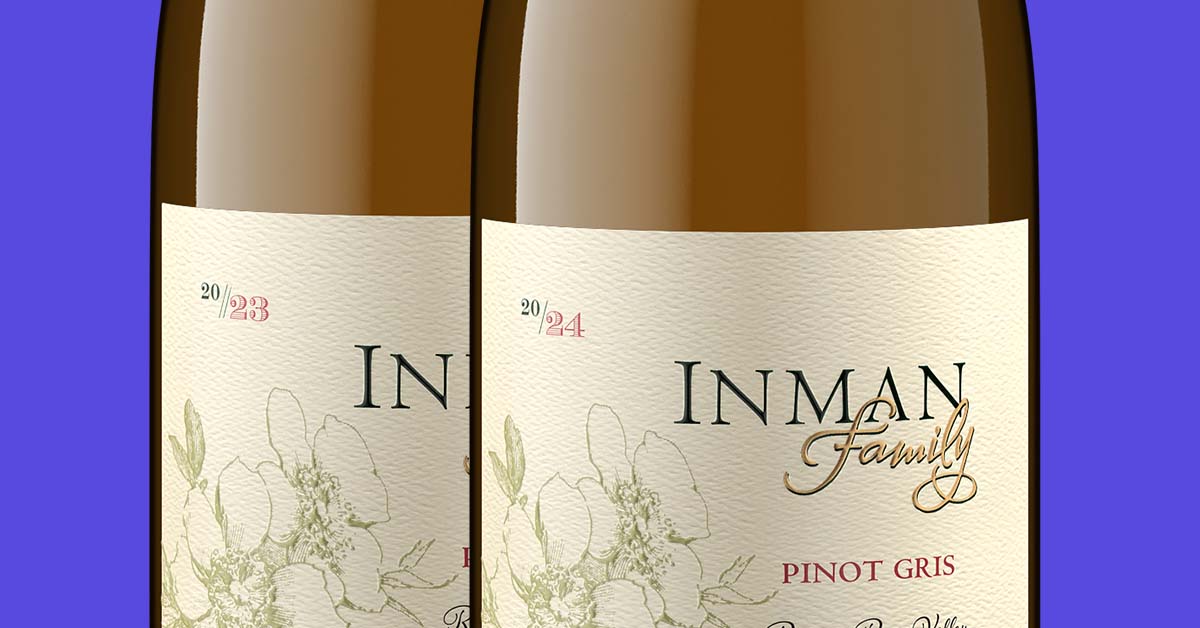
The state of wine product imagery 2026
Seven findings from 189 wine storefronts and 11,111 wines, measured September 2026.


Most wine catalogs were not photographed. They were assembled, one migration at a time, by different people, over several years. This is what that looks like across 189 wine storefronts and 11,111 wines.
Before any number, one check you can run yourself. It takes ten seconds, on your own files, and asks you to trust nothing.
Open the folder where your bottle shots live. Select them all. Look at the thumbnails. Are they all the same shape, or a mix of tall, square and everything in between?
Whatever you saw, the rest of this study explains how it got that way and how common it is.
What we measured
Outshinery measured 189 wine storefronts, 11,111 wine products and 10,217 lead images on September 4, 2026, across the United States, Canada, Australia, New Zealand and South Africa. Every store was measured through the Commerce7 storefront API, because Commerce7 is the only large wine commerce platform that exposes one.
The findings below describe how wineries produce and manage their imagery, not the platform that hosts it. The full method, including why Commerce7, sits at the end of the article.
The standard we measured against is not ours. Commerce7's own image documentation says "Consistency is key. Try to crop your images to the same dimensions each time." OrderPort's Webstore Configuration Guide says "All bottle shots should be the same size and maintain the same aspect ratio."
The platforms already ask for consistency, in plain language. The seven findings below describe how far the typical catalog sits from it.
1. The image files do not match, even if the shop grid tries to tidy them up
74% of wine storefronts carry product images in mismatched proportions. The store layout does its best to tidy them up, and the shelf still looks a little clumsy.
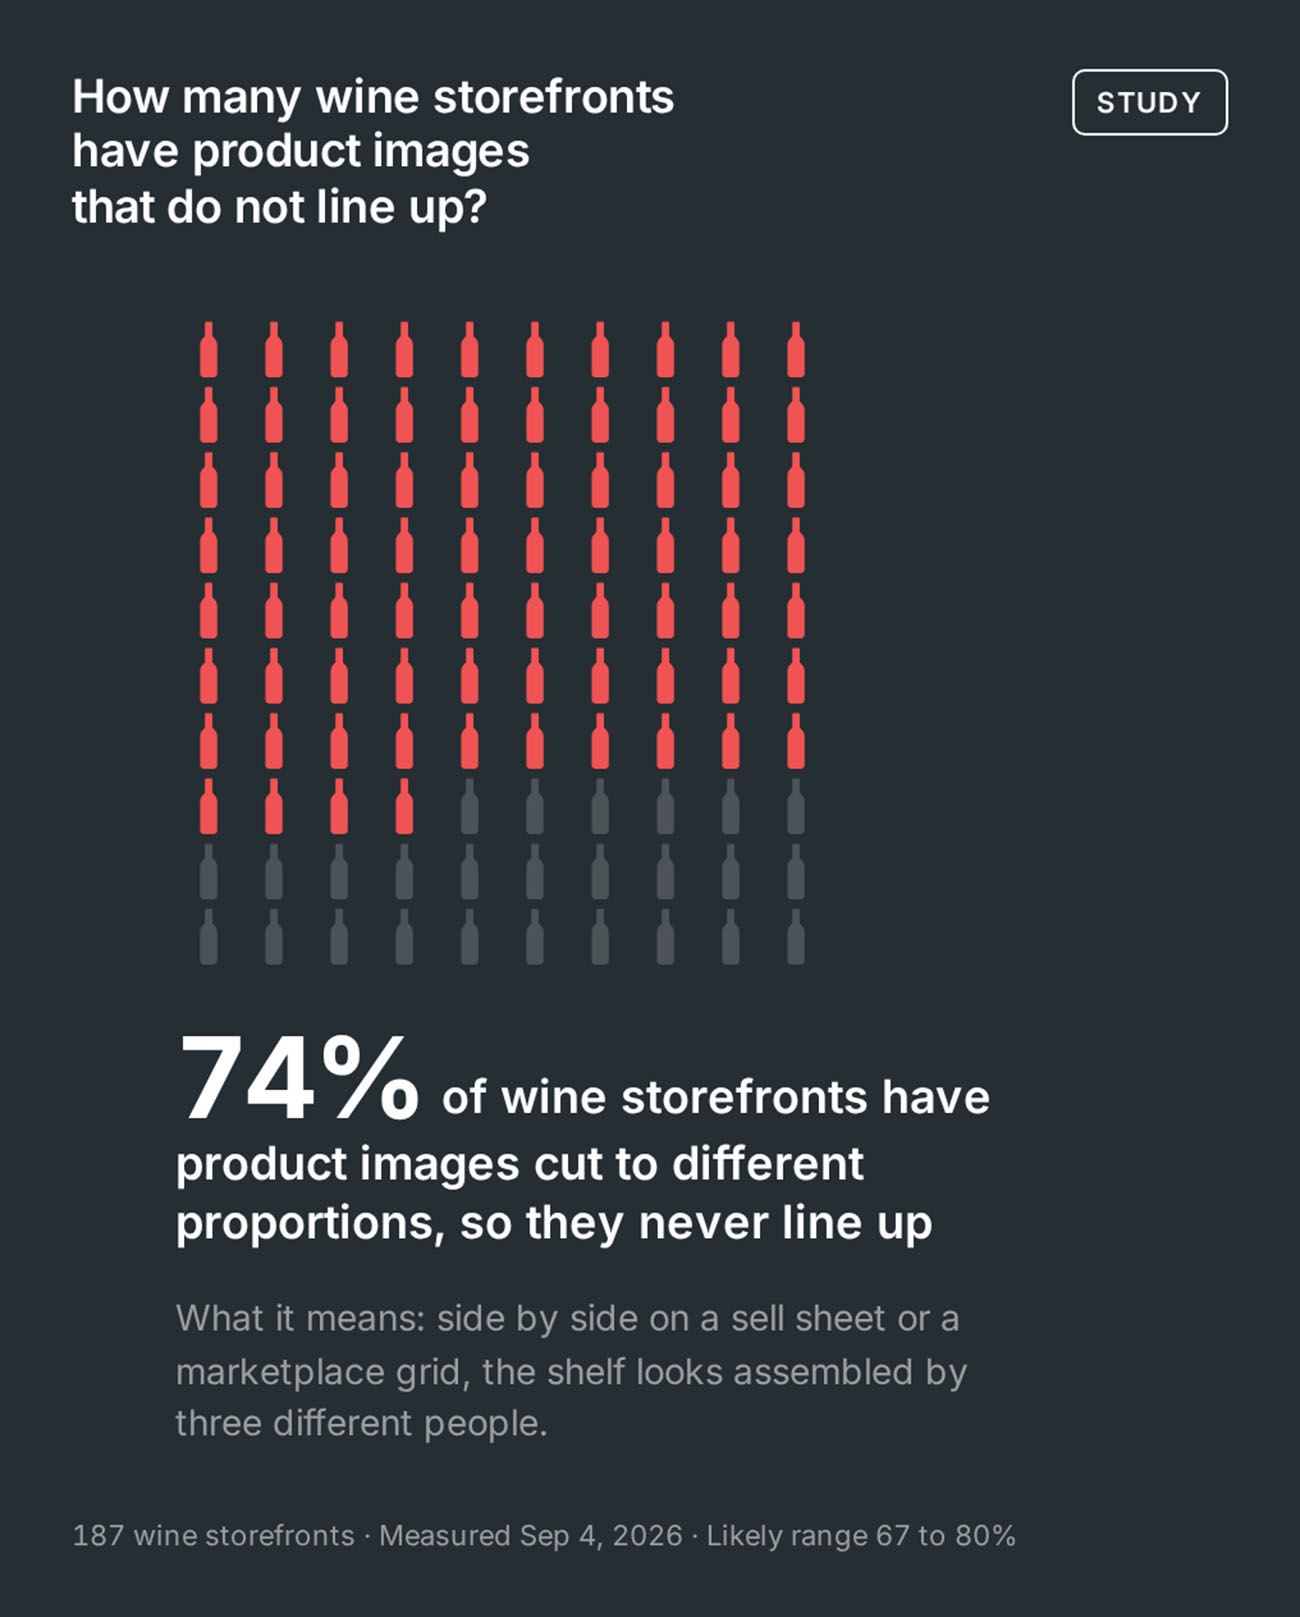
What it means. The photos were saved at different proportions over the years, and the shop page softens it. Commerce7 themes place each image in a fixed box, so the grid stays even whatever proportions the files are in.
That is good design. It is also why the mismatch is easy to miss: the one surface the winery looks at every day is the one that softens it.
The same files go to trade sheets, distributor decks, retailer submissions, marketplace listings and email. No theme stands between the image and the reader there.
Why it matters. The storefront is the one place the mismatch gets softened. Everywhere else the files are used as they are, and images of three different proportions will not sit at the same height in a sell sheet, a distributor's portal or a retailer's grid.
A catalog that looks fine on its own site can still fall apart the first time its files are used anywhere else.
Shoppers notice. In Salsify's October 2024 survey of 1,910 US and UK consumers, 54% said they had abandoned a purchase because product content was not consistent from one channel to the next.
Method note 1, at the end of the article.
2. Most listings give the shopper one photograph
82% of wine listings have exactly one photo. Roughly half of wineries have exactly one on every wine they sell.

What it means. One image is doing all the work at once: the label, the bottle shape, the size, the closure.
Whatever that one image leaves out, the back label included, is not shown at all.
Why it matters. There is information on a wine bottle that a single front-label photo cannot show. The alcohol percentage, the blend, the closure, the back-label story, the size next to a hand.
A single image cannot show all of it. Akeneo's February 2026 survey of about 1,000 US consumers found 35% naming missing or unclear visuals as a reason not to buy, and in Coresight Research's 2022 survey of 193 brand and retailer executives, sponsored by nfinite, 81% said they show five or more visuals per product.
Method note 2, at the end of the article.
3. The expensive wine gets the same photo as the cheap one
Your most expensive wine gets no more images than your least expensive, and the same resolution. We found no measurable difference on either.

What it means. Across 184 wineries, the premium third of the catalog costs nearly three times the entry third. The image count is identical in most stores, and the median resolution is identical, to the pixel, in two thirds.
Matching resolution is consistency, and consistency is the point. The same number of images on a wine that costs three times more is the part to look at.
Why it matters. NIQ reports that online beverage alcohol shoppers are twice as likely as in-store shoppers to place themselves at the premium end of a price-quality scale (28% against 13%). Whatever that shopper is looking for, the catalog does not present its highest-priced wine any differently from its lowest.
The pattern does not track price, which is the one thing we tested. It is what a single upload pipeline produces when every wine goes through it the same way.
Look at your most expensive wine and your cheapest, side by side. Can you tell which one costs three times more from the photographs?
Method note 3, at the end of the article.
4. Half your photos arrived in one burst
In the typical winery, roughly half the product catalog was uploaded in a single burst, a run of uploads a few weeks long with a long quiet stretch on either side.

What it means. The pattern is consistent with a website rebuild or a platform move, when the whole catalog is loaded in one push. Within that burst, the images match each other in proportion in about half of wineries and do not in the other half.
Why it matters. A rebuild or platform move is the one moment a winery handles every product image it owns. In about half the wineries we measured, the images that arrived in that burst share one set of proportions; in the other half, the burst carries images at whatever proportions they already had.
The moment is the same for both. What goes through it is the difference between a set of files that match and one that does not.
If your store was rebuilt or moved platforms in the last few years, you have one of these bursts. The images that came through it are the ones to look at first.
Method note 4, at the end of the article.
5. One listing in eleven shows the wrong vintage
About one wine listing in eleven shows a photograph of a different vintage from the one in the product title, among the listings where this could be checked.
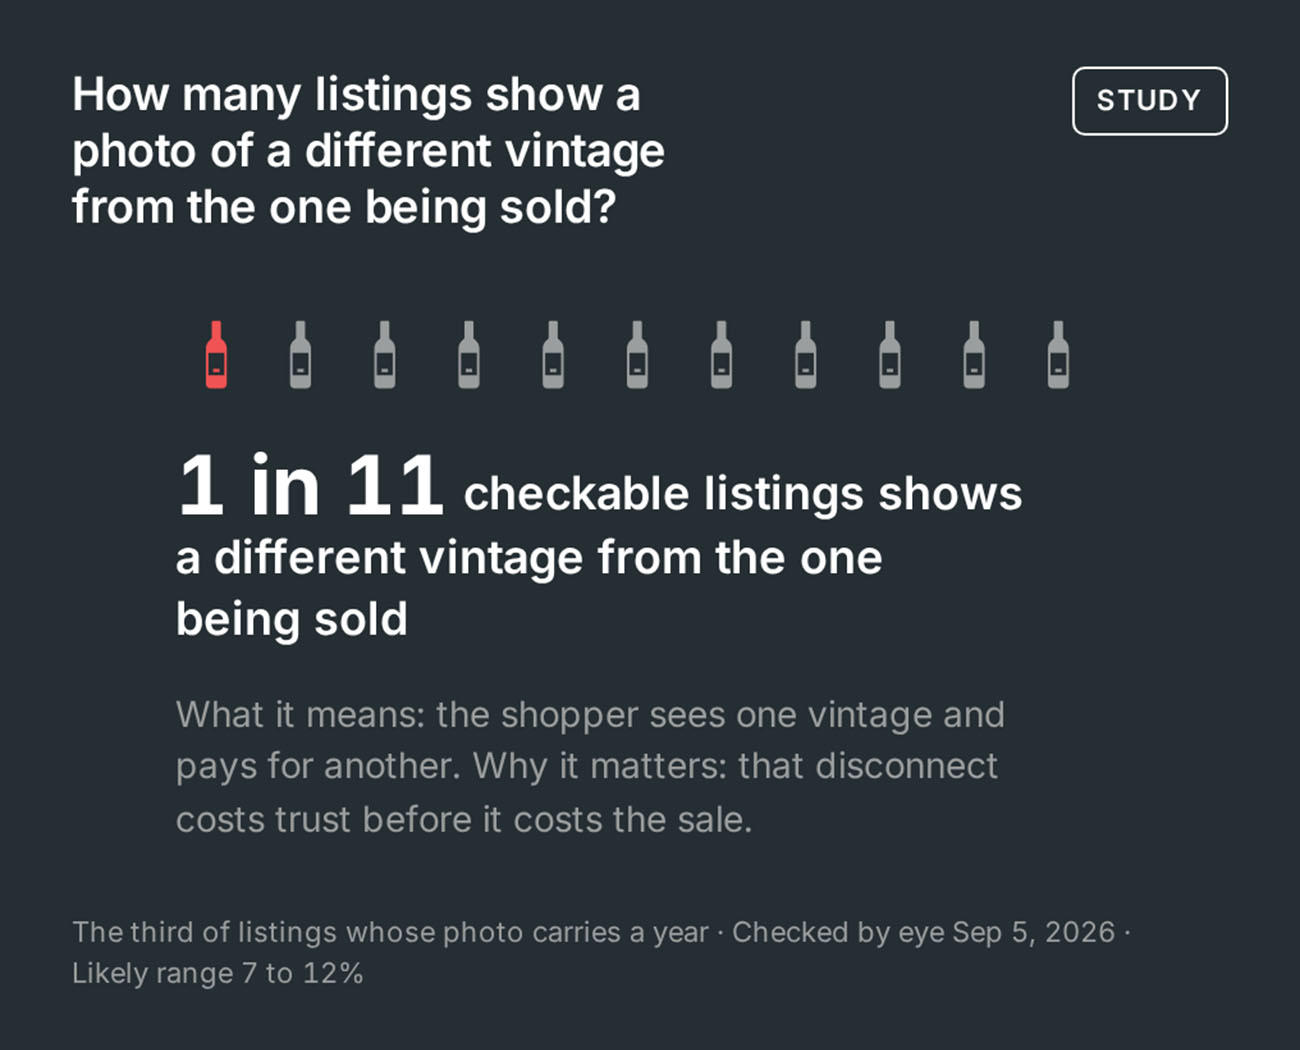
What it means. The vintage rolled over in the product title. The photograph did not.
In most cases it is the previous vintage's bottle still standing in for the new one; in a few it is a library wine wearing the current release's photo. Some wineries sidestep the problem with a vintage-neutral image that serves every release; the check found labels with no vintage printed, but could not tell deliberate ones from non-vintage wines, so no rate is given.
Why it matters. For a category where the vintage is part of what is being bought, the photograph is part of the product description.
If it shows a different vintage from the one in the title, the page is describing two wines at once.
A new vintage rarely changes only the year on the label. The alcohol percentage moves, the vineyard or appellation can move when fruit is sourced differently, and every one of those details is printed on the label in the photograph.
The cost of a listing that does not match what arrives is not ours to guess at; shoppers report it. In the same Salsify survey, 71% said they had returned an item because it did not match the online listing.
Method note 5, at the end of the article.

6. The oldest and newest photo are years apart
In a third of wineries, the oldest product photo on the site and the newest are more than three years apart.
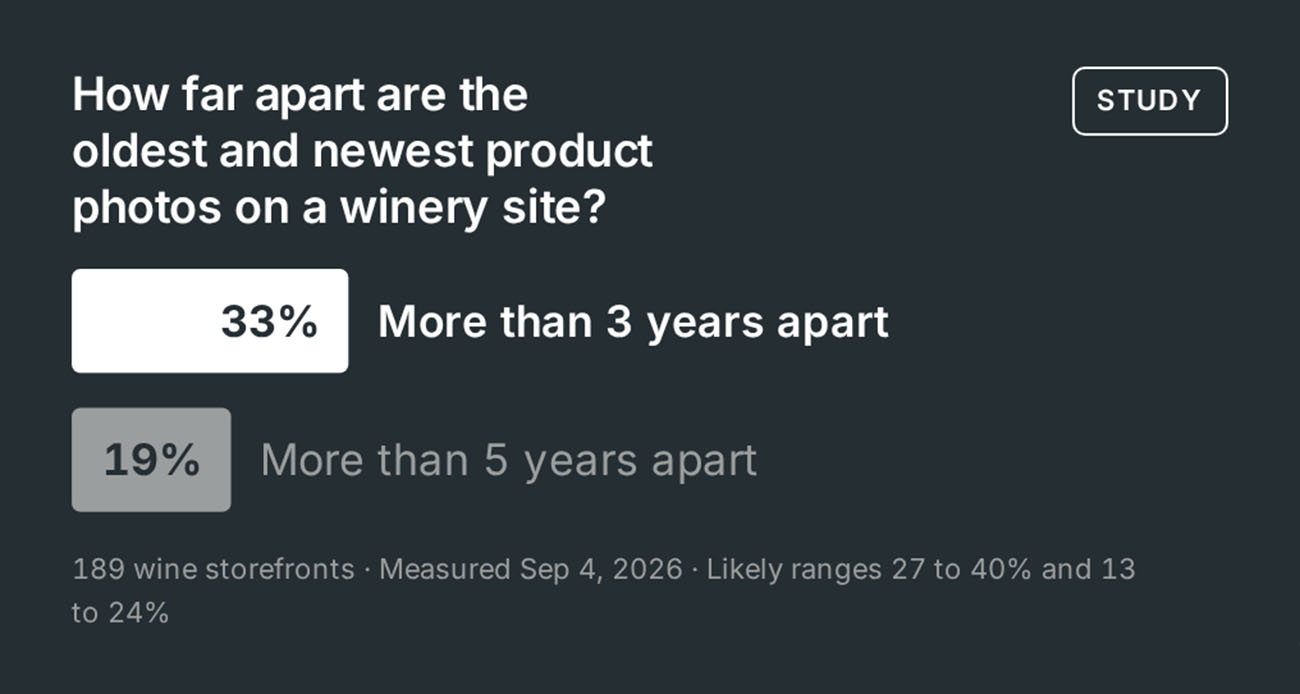
What it means. The images were uploaded years apart, under whatever conditions applied each time. Since 2016, working with winery catalogs, Outshinery has seen what that usually means: a different camera, a different lighting setup, a different photographer, sometimes a different agency, for each release.
Then all of it sits on one shelf.
Why it matters. Each photo was uploaded on its own day. The set was assembled over years, and nothing in that process checks the images against each other.
The individual image is rarely the problem. The catalog is.
Method note 6, at the end of the article.
7. A third of images cannot fill a phone screen
A third of wine product images cannot fill a modern phone screen at full sharpness. Zooming in only makes them blurrier.
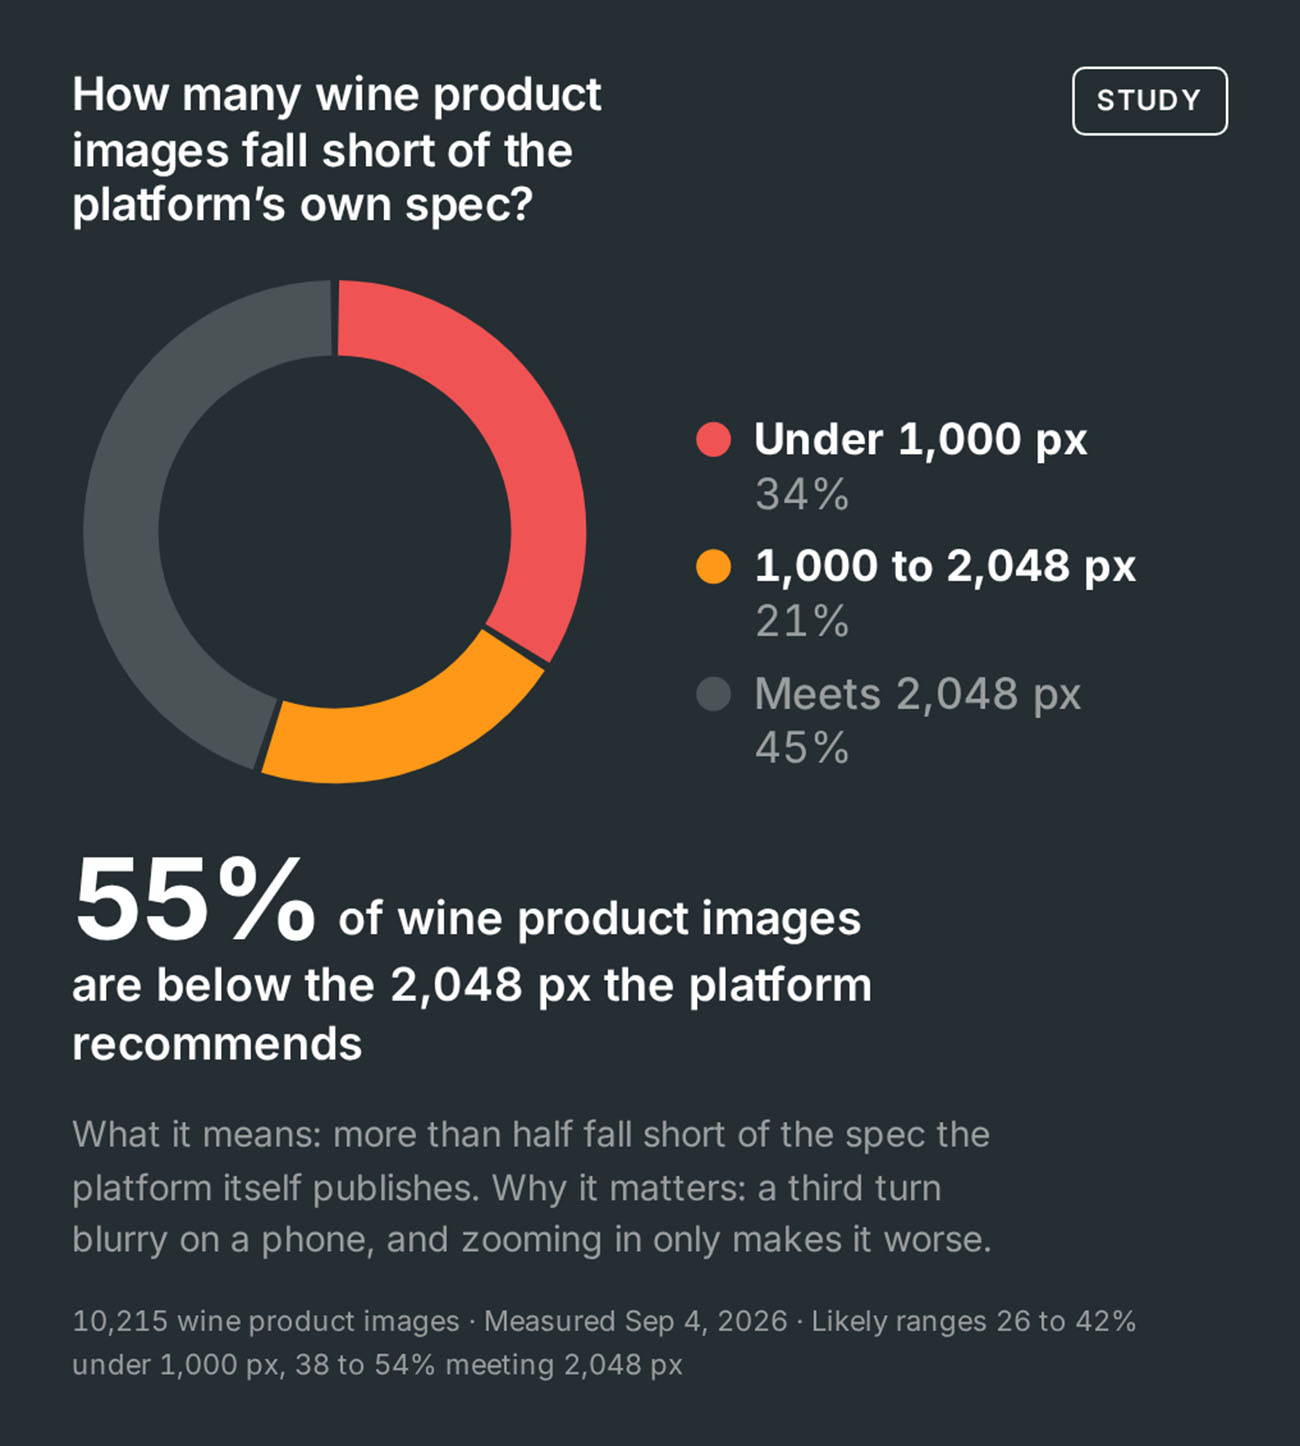
What it means. The long edge is under 1,000 pixels, so the label blurs the moment a shopper enlarges it, and the fine print becomes unreadable first. Nearly a quarter are 300 pixels wide or less, which is the size of a thumbnail from a website built a decade ago.
Why it matters. The original file has fewer pixels than the screen it is shown on, and nothing on the page can add them back.
On a phone, the label is most of what the shopper sees.
Method note 7, at the end of the article.
What the seven findings add up to
The expensive wines are not treated any better than the cheap ones, and that is the clue. This looks less like neglect than like a catalog that grew one release at a time, through one upload pipeline, with nobody asked to look at the whole set together.
When did you last look at all your product photos together, rather than one at a time as each release went live? For many of the wineries in this sample, the data points to one moment, a rebuild or a platform move, when roughly half the catalog arrived at once.
The fix is the same moment, handled differently. Every wine brought to the same proportions, the same resolution and the same light, so the files match before they leave the site.
That is the work Outshinery Studio does: trained 3D artists build each wine from its label file and render the whole catalog to one standard.
For a short list of wines whose labels carry no foil, embossing or other raised finishes, Outshinery Lite is the self-serve version: upload the label file, pick the bottle and closure, and a bottle shot arrives in about an hour, every one at the same proportions and size.
The study stands on its own either way, and the folder check at the top of this article costs nothing.
Method and limitations
Outshinery measured 189 wine storefronts covering 11,111 wine products and 10,217 lead images, 10,215 of which could be measured for dimensions, on September 4, 2026, across the United States, Canada, Australia, New Zealand and South Africa. US stores were drawn from ten regions including Napa, Sonoma, Paso Robles, Willamette, Washington, the Finger Lakes, Virginia, Texas, Michigan and Arizona. Stores were measured through the Commerce7 storefront API. The sample is a convenience sample of findable Commerce7 storefronts with at least five wines listed, not a random draw of the platform. Measurements are of each product's first image as uploaded, not the resized version a shopper sees; a small original cannot become a sharp large one, so the resolution findings carry through. Product pulls were capped at 600 per store; one store hit that cap on wine products. Confidence intervals are bootstrapped by resampling stores, 2,000 iterations, except where a finding rests on a by-eye check, whose interval comes from that check's own sample and is labeled as such.
Every "likely range" in this article is a 95% confidence interval. If the same measurement were repeated on a fresh draw of stores, the figure would land inside that range about 95 times in 100.
Method notes
1. Proportions. 73.8% of stores carry lead images whose proportions differ by more than 1.25x (likely range 67 to 80), on the 187 stores with at least 8 measurable images. In the median store the tallest bottle image is 2.2 times the shortest once scaled to a common width (likely range 1.9 to 2.7), and 80% of stores use more than three distinct image sizes, median eight. These are properties of the files, not of the shop page: ten sampled storefronts all looked even on the page.
2. Image count. 82% of listings carry one image (likely range 74 to 88), 6% two, 4% three or more. Store-averaged, 85%. 49.7% of stores have one image on every wine (likely range 43 to 57); that range includes half, so "roughly half."
3. Price. 8,838 priced listings across 184 stores, each store's cheapest third against its most expensive third, median price ratio 2.7x. Images per wine 1.21 against 1.19; median long edge 1,828 px against 1,860 px; share under 1,000 px 29% against 27%. Every difference sits inside a likely range that includes zero. Only resolution and image count were tested. The premium-shopper figure (28% against 13%) is NIQ's self-reported number from its July 2026 beverage alcohol path-to-purchase report, published without sample size or question wording.
4. Upload bursts. Across 179 stores with at least 12 dated wines, the median store received 48% of its catalog in one upload cluster, a run of uploads with no 30-day gap, and that cluster spans a median of 16 days. Half of stores have one cluster holding more than half the catalog (likely range 42 to 57). Within the largest cluster, all proportions fall within 1.25x of each other in 55% of stores (likely range 47 to 62), so the split is reported as a split.
5. Vintage. A third of lead images (3,432) carry a year in the filename; in 607 the year disagrees with the title. A by-eye check of 100 of those, at most three per store, confirmed a different vintage on the label in 53, the same vintage in 5, and could not judge 42. Applied to the flag rate, the confirmed floor is about 9% of checkable listings, one in eleven (likely range 7 to 12). Nothing is claimed for the two thirds of listings whose filenames carry no year.
6. Image age. The median span between a store's oldest and newest lead image is 1.9 years (likely range 1.4 to 2.2); 33% of stores span more than three years (likely range 27 to 40) and 19% more than five (likely range 13 to 24). Dated from the upload timestamp in every filename. Upload date is not photograph date.
7. Resolution. 34% of lead images are under 1,000 px on the long edge (likely range 26 to 42); 23% are 300 px wide or narrower (likely range 17 to 31). Median image 799 x 1,625 px. Commerce7 recommends 2,048 px; 45% meet it (likely range 38 to 54).
Two ways of counting
Some figures are product-weighted: every wine listing counts once, so a store with 300 wines weighs more than a store with 12. That answers "what does a random wine listing look like."
Others are store-averaged: every winery counts once, whatever its size. That answers "what does the typical winery look like." Each method note says which one it uses.
Why Commerce7
Commerce7 was measured because it is the only large wine commerce platform that exposes a public storefront API. To size that choice, we fingerprinted the homepages of 1,629 winery websites listed in six US regional association directories (Washington State Wine, Napa Valley Vintners, Willamette Valley Wineries Association, Michigan Craft Beverage Council, Texas Wine and Grape Growers Association, Finger Lakes Wine Alliance) on September 5, 2026.
Of the 1,344 whose homepage we could read (160 did not answer and 125 returned a bot-challenge page instead of the site), 26.9% carried Commerce7 code, 13.2% OrderPort, and 8.4% VinoShipper; a site can carry more than one. Those are shares of association-listed sites, weighted toward the West Coast, not shares of the wine market.
OrderPort offers catalog access only as a paid per-winery integration, VinoShipper publishes no image specification, and neither exposes a public storefront endpoint, so independent measurement at this scale is possible on Commerce7 and not currently possible elsewhere.
The by-eye check
Finding 5 rests on a check of 100 flagged listings, drawn at random with no more than three per store. The labels were read by one AI vision model, and every reading was logged per listing so any row can be re-verified from the image.
Finding 1's note on shop grids rests on ten sampled storefronts opened by a person on September 5, 2026. All ten looked even on the page, which is why this study sends you to your image folder rather than your shop.
What was not measured
Lighting, background, crop, styling and the content of each image were not classified. Only the first image of each product was measured, so nothing here describes second or third images.
Nothing in this study measures what shoppers do or feel. No finding here says that any of these properties changes a purchase, and none should be read that way.
Other published surveys of winery websites, on different samples and with different definitions of multi-image use, are not directly comparable to ours. No region-by-region comparison is published, because the differences between regions fell inside their likely ranges.
Further reading
For a wider view of winery websites across California, Oregon and Washington, including brand and technical dimensions we did not measure, see Transom's Digital Winery Report.
Frequently asked questions
How many wine storefronts did the study measure?
189 wine storefronts, 11,111 wine products and 10,217 lead images, measured on September 4, 2026 through the Commerce7 storefront API. Stores were in the United States, Canada, Australia, New Zealand and South Africa, with US stores drawn from ten regions.
Why was the study measured on Commerce7?
Because Commerce7 is the only large wine commerce platform that exposes a public storefront API, which made 189 catalogs measurable at once. The findings describe how wineries produce imagery: mismatched image proportions, upload bursts, image age and the price null are properties of the files wineries upload, not of the platform that hosts them.
How do I check whether my own bottle shots match?
Open the folder where your bottle shots live, select them all, and look at the thumbnails. If they are a mix of tall, square and everything between, your files are in mismatched proportions, even if your shop page looks even, because most shop themes place each image in a fixed box.
Does the study show that better images sell more wine?
No. The study measured image files, not shopper behavior, and it makes no claim about purchasing or perception. It describes what the files are: their proportions, their resolution, their count, their age and their vintage against the product title.
What is the most common problem in wine product imagery?
Mismatched image proportions within one catalog. 74% of the wine storefronts measured carry product images whose proportions differ by more than 1.25x, and 80% use more than three distinct image sizes, with a median of eight.
The seven-finding self-check
- Proportions: Open the folder where your bottle shots live and select all. Every thumbnail the same height against width, or a mix of tall and square
- Image count: Pick five wines on your shop. How many carry more than one image
- Price: Put your most expensive wine next to your cheapest. Same number of images, same file size, or a difference
- Upload bursts: Sort the folder by date. Find the biggest run of files that arrived within a few weeks of each other, and whether those match each other in proportion
- Vintage: For every current release, read the year printed on the label in the photo against the year in the product title
- Image age: In the same date-sorted folder, the gap between the oldest file and the newest, in years
- Resolution: Open the smallest file and read its pixel dimensions. Under 1,000 pixels on the long edge blurs on a phone